
Guides
Where a coworking space does best: markets to consider
Nashville, Austin, Raleigh and Salt Lake City reward operators who can price desks against local wages and office rents. Here is how to read a market.
What to take away
- The five markets to weigh are Nashville, Austin, Raleigh-Durham, Salt Lake City and Boise; the comparison below pairs each with the operator type it fits.
- A market is right for a coworking space only if local office rent, median wage and commute patterns let you fill desks at a price members will pay.
- Check BLS employment data for your own metro before you sign a lease; the numbers move every quarter.
- A market with strong job growth but no transit and no walkable lunch is harder than its headline suggests.
- Two markets can share a name and behave differentlya downtown submarket and a suburban office park are not the same bet.
This article gives general coworking-business information. It does not give individualized advice on these topics:
- lease
- zoning
- occupancy
- fire
- accessibility
- tax
- legal
Requirements depend on the jurisdiction and the building. Confirm current duties with the local authority having jurisdiction and a licensed professional.
Why "best market" is a local question
A market is good when enough people with expense accounts work close enough to walk in. That is the whole test.
Key market numbers
- $24–$70 | Class A asking rent per sq ft per year
- $60K–$140K | Median earnings for member roles
- $200–$400 | Typical monthly hot desk price
- $600–$1,500 | Typical monthly private office price
National rankings hide the part that matters: the ratio of local office asking rent to local median wage for the roles your members hold.
Class A asking rents in the five metros below typically run $24 to $70 per square foot per year as of 2026, based on the BLS OEWS May 2024 metro estimates and CES metro releases.
Median earnings for the roles coworking members hold, from software to healthcare administration, typically run $60,000 to $140,000, based on the same OEWS release and Census ACS 2023 5-year estimates.
When office rent is high and wages are low, members cannot pay enough to cover your lease. When both are moderate, you can price a desk and still clear the month.
Hot desks in these metros typically list at $200 to $400 a month. Private offices for two to four people typically run $600 to $1,500.
The per-metro rent bands below come from the same BLS and Census sources.
Five markets and the demand behind each
Nashville. Healthcare administration, music and back-office finance keep a steady flow of small teams. HCA Healthcare, Vanderbilt University Medical Center and Nissan's Franklin campus anchor the payroll.
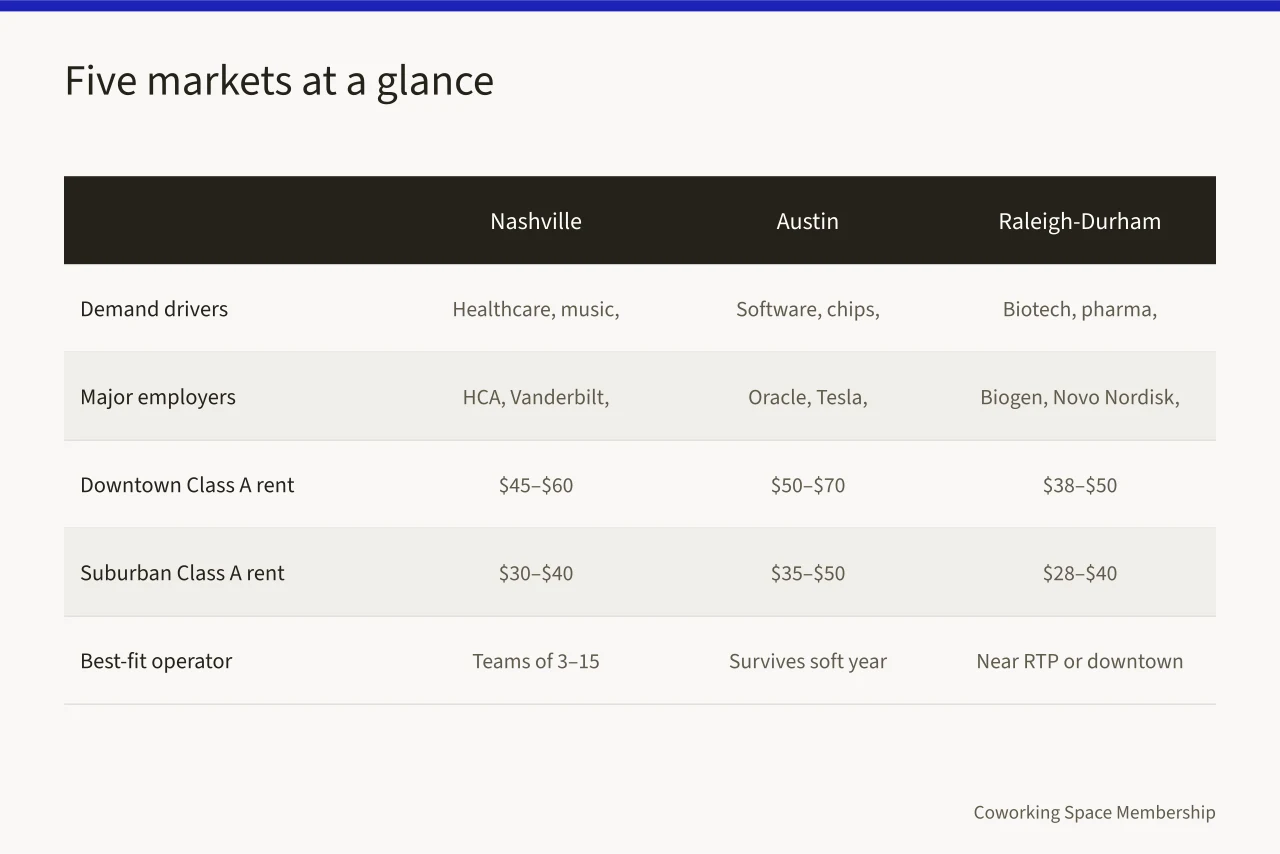
Class A asking rents typically run $45 to $60 per square foot downtown and in the Gulch. Brentwood and Cool Springs trade a longer commute for cheaper space, typically $30 to $40. Suits operators who can serve teams of three to fifteen.
Austin. Software, chip design and a large state university produce a young, mobile workforce. Oracle, Tesla, Samsung Austin Semiconductor and Apple all run major operations in the metro, and the University of Texas at Austin supplies interns.
Downtown Class A asking rents typically run $50 to $70 per square foot; the Domain and Round Rock run $35 to $50. Office supply grew fast, so asking rents soften in cycles. Suits operators who can survive a soft year and hold members through it.
Raleigh-Durham. Research Triangle Park anchors biotech, pharma and university research. Biogen, Novo Nordisk's Clayton plant and Pfizer's Sanford site sit in the park and around it.
Duke, UNC and NC State supply the graduates, so demand skews toward lab-adjacent and professional services teams. Downtown Raleigh Class A asking rents typically run $38 to $50 per square foot; RTP runs $28 to $40. Suits operators near RTP or downtown Raleigh who can serve longer leases.
Salt Lake City. Software, finance and a growing outdoor-industry cluster drive demand. Goldman Sachs, Adobe's Lehi campus and Qualtrics anchor the tech and finance payroll.
Backcountry and Black Diamond Equipment keep the outdoor cluster. Downtown Class A asking rents typically run $30 to $42 per square foot; the Silicon Slopes corridor in Lehi and Provo runs $26 to $36.
TRAX light rail and the FrontRunner commuter train cover part of the valley. Commutes are still car-heavy, so parking is part of the product: a monthly stall downtown typically runs $100 to $200. Suits operators who can secure parking and price it into the membership.
Boise. Smaller base, cheaper entry, growing tech presence. Micron Technology and Clearwater Analytics are headquartered downtown, and Albertsons and the J.R. Simplot Company are based in the metro.
Downtown Class A asking rents typically run $24 to $34 per square foot. Median wages sit below the other four metros, so membership pricing lands lower. Suits a first location where the operator can be the only real option in a submarket.
For the Canadian second market, Toronto, Calgary and Vancouver follow the same test, using Statistics Canada wage data and local office reports.
How to check a market yourself
Pull employment and wage data for the metro from the Bureau of Labor Statistics. The Occupational Employment and Wage Statistics May 2024 release reports median wages by occupation and metro. The Current Employment Statistics program reports monthly payroll counts.
Check a market yourself
- Pull wage data from BLS OEWS
- Pull payroll counts from BLS CES
- Pull commute data from Census ACS
- Pull worker locations from LEHD LODES
- Run rent vs desk revenue arithmetic
Pull population and commute data from the Census Bureau. The American Community Survey 2023 5-year estimates report commute times, and the LEHD LODES files show where workers live and where they work. Then run the arithmetic with your own numbers:
- Office asking rent per square foot, per year
R - Usable square feet
S - Desks you can fit
D - Monthly membership price
P
Your annual rent is R × S. Your annual desk revenue is P × D × O × 12. If the second number does not clear the first plus staffing and CAM, the market is not ready for your format.
What to verify before you commit
Zoning, occupancy limits and building code duties sit with the local authority having jurisdiction. Confirm them before you sign anything.
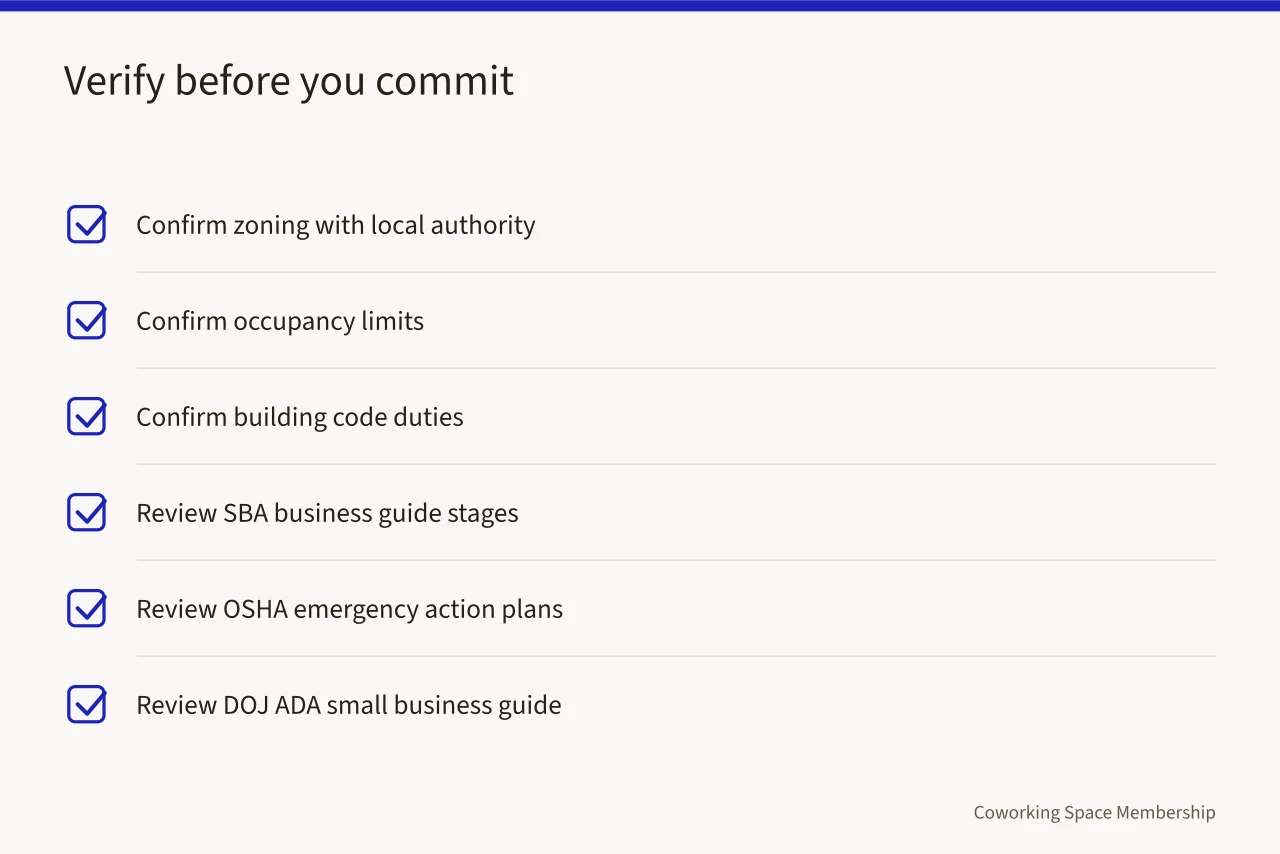
For market research, the U.S. Small Business Administration: SBA Business Guide organizes ownership into four stages. These stages are planning, launch, management and growth. The guide covers these topics:
- market research
- startup costs
- permits
- insurance
- hiring
For emergency planning, Occupational Safety and Health Administration: Emergency Action Plans covers reporting, evacuation, accountability, contacts and training where they apply.
For accessibility, the U.S. Department of Justice: ADA Guide for Small Businesses explains barrier removal, accessible routes and service practices for existing facilities.
Comparing the five markets
Marketing channels compared
Channel
- Word of mouth
- Visible desk results
- Chamber and Meetup
- Partner sees need first
- Google Business Profile
- Reviews accumulate monthly
- Coworker.com, LiquidSpace
- Travelers need week desk
- Win-back email
- Need recurs in January
Fits when
- Word of mouth
- Fades without referrals
- Chamber and Meetup
- One relationship dependence
- Google Business Profile
- Competitors bid same terms
- Coworker.com, LiquidSpace
- Platform owns booking
- Win-back email
- Requires kept records
Weak point
- Word of mouth
- Chamber and Meetup
- Google Business Profile
- Coworker.com, LiquidSpace
- Win-back email
No single market wins overall; the table below shows which operator type each market fits.
Class A asking rent, typical
- Nashville
- $45 to $60 downtown and Gulch; $30 to $40 Brentwood and Cool Springs
- Austin
- $50 to $70 downtown; $35 to $50 Domain and Round Rock
- Raleigh-Durham
- $38 to $50 downtown Raleigh; $28 to $40 RTP
- Salt Lake City
- $30 to $42 downtown; $26 to $36 Lehi and Provo
- Boise
- $24 to $34 downtown
Fits which operator
- Nashville
- Teams of three to fifteen serving healthcare and finance
- Austin
- Operators who can hold members through a soft rent year
- Raleigh-Durham
- Operators near RTP or downtown who can serve longer leases
- Salt Lake City
- Operators who can secure parking
- Boise
- A first location where the operator can be the only real option in a submarket
Parting checks
Once you pick a market, the next step is a coworking space plan that lists every operating decision before you sign.
Then revisit the expansion goal every month. A market that looked right in January can look wrong by June if asking rents moved and your occupancy did not.
Common questions
Which market is best for a first coworking space?
Boise and Salt Lake City let a first operator be the clear option in a submarket without competing on downtown rents. Downtown Boise Class A asking rents typically run $24 to $34 per square foot, below Nashville and Austin. Nashville and Austin reward operators who already have local relationships. Check BLS wage data for your metro before deciding.
How do I know if a market can support my pricing?
Run the rent-to-revenue arithmetic above with your own figures. If the result does not clear rent, staffing and CAM, the market is not ready for your format.
What data should I check before signing a lease?
Pull employment and wage data from the Bureau of Labor Statistics and population and commute data from the Census Bureau for the specific submarket. Confirm zoning and occupancy requirements with the local authority having jurisdiction and a licensed professional.